Leveraging Excel for Automating Unusual Transaction Reporting in Accounts Payable
Excel can streamline the identification of unusual transactions in accounts payable by automating exception reporting, making reviews more efficient for accountants.
For accountants inundated with accounts payable exports each month, sorting through data to flag unusual transactions can be time-consuming. Fortunately, Excel offers powerful tools to automate this process. By implementing exception reporting techniques, users can focus their attention on just the transactions that may require further scrutiny, significantly enhancing efficiency.
Setting Up Your Excel Workbook
To illustrate how this can be achieved, let’s start with a practical example based on a sample accounts payable (AP) export. This example uses Excel for Microsoft 365, which supports dynamic array functions. Users can download the sample workbook here to replicate the steps outlined in this guide.
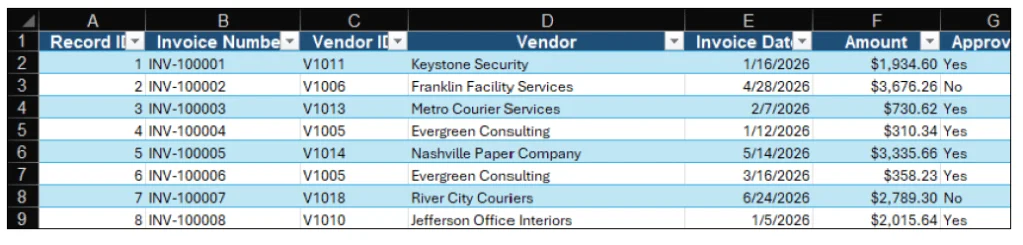
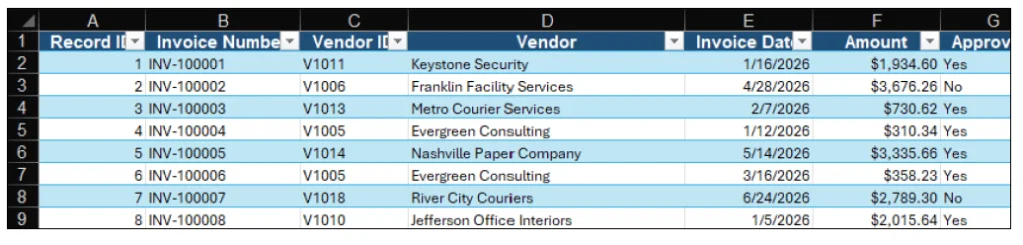
The sample workbook contains 300 transactions, detailing aspects such as Record ID, Invoice Number, Vendor ID, Vendor Name, Invoice Date, Amount, and other relevant details essential for the analysis. Start by converting the raw data into an Excel table for easier management. Navigate to the Insert tab on the ribbon and choose Table, ensuring the option for headers is selected. After confirming, rename the table to Invoices within the Table Design section. This ensures dynamic formulas adapt as new data is added.
Creating Exception Tests
To enable efficient reporting, add six new columns to the right of your data, labeling them: High-Dollar Unapproved, Missing PO, Missing Vendor ID, Duplicate Invoice, Weekend Posting, and Exception Status. Each additional column serves a specific purpose in analyzing transaction data, detecting issues that may necessitate follow-up.
1. **High-Dollar Unapproved**: Identify invoices exceeding a designated dollar threshold that haven’t received approval. Set the threshold in cell B3 of the Dashboard worksheet to $10,000 for this example. Enter the following formula in cell L2 (under High-Dollar Unapproved):
=IF(AND(F2>Dashboard!$B$3,G2="No"),"Yes","")
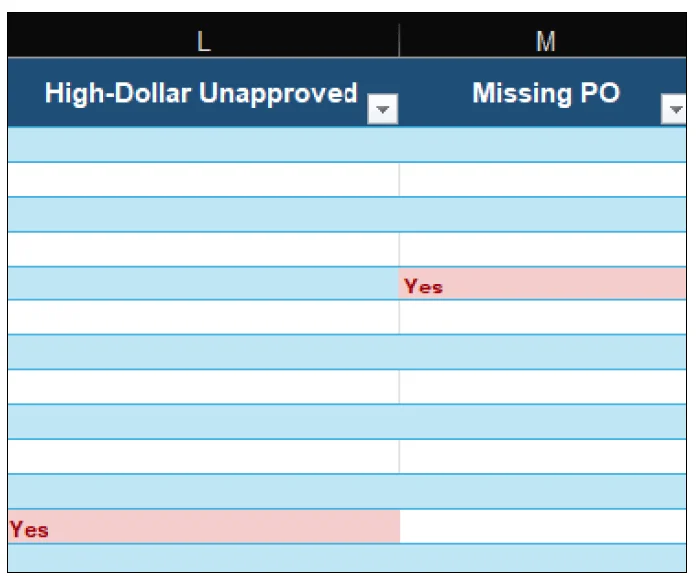
This formula flags invoices as "Yes" when both conditions are satisfied, and because the dataset is in a table format, Excel replicates this formula for the remaining rows.
2. **Missing PO**: In cell M2, enter:
=IF(I2="","Yes","")
This formula detects invoices without purchase orders.
3. **Missing Vendor ID**: In cell N2, utilize:
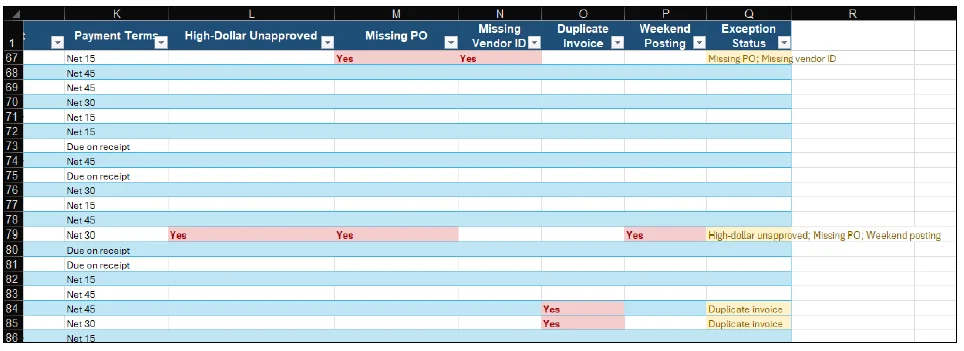
=IF(C2="","Yes","")
This will signify any entries lacking a vendor ID.
4. **Duplicate Invoice**: For duplicate entries, place the following in cell O2:
=IF(COUNTIF($B$2:$B$301,B2)>1,"Yes","")
This assesses if the invoice number in the current row appears more than once in the dataset, marking the row accordingly.
5. **Weekend Posting**: Lastly, to catch invoices dated during the weekend, enter in cell P2:
=IF(WEEKDAY(E2,2)>5,"Yes","")
This utilizes the WEEKDAY function to identify any invoices posted on Saturday or Sunday.
Combining the Results
The last column, Exception Status, consolidates all above tests using the LET and TEXTJOIN functions to present the findings clearly. In cell Q2, key in:
=LET(HighAmt,L2="Yes",MissingPO,M2="Yes",DupInv,O2="Yes",MissingVendor,N2="Yes",WeekendPost,P2="Yes",TEXTJOIN("; ",TRUE,IF(HighAmt,"High-dollar unapproved",""),IF(MissingPO,"Missing PO",""),IF(DupInv,"Duplicate invoice",""),IF(MissingVendor,"Missing vendor ID",""),IF(WeekendPost,"Weekend posting","")))
This formula ensures all relevant exceptions display in a single cell, enhancing readability and comprehension.
Generating the Exception Report
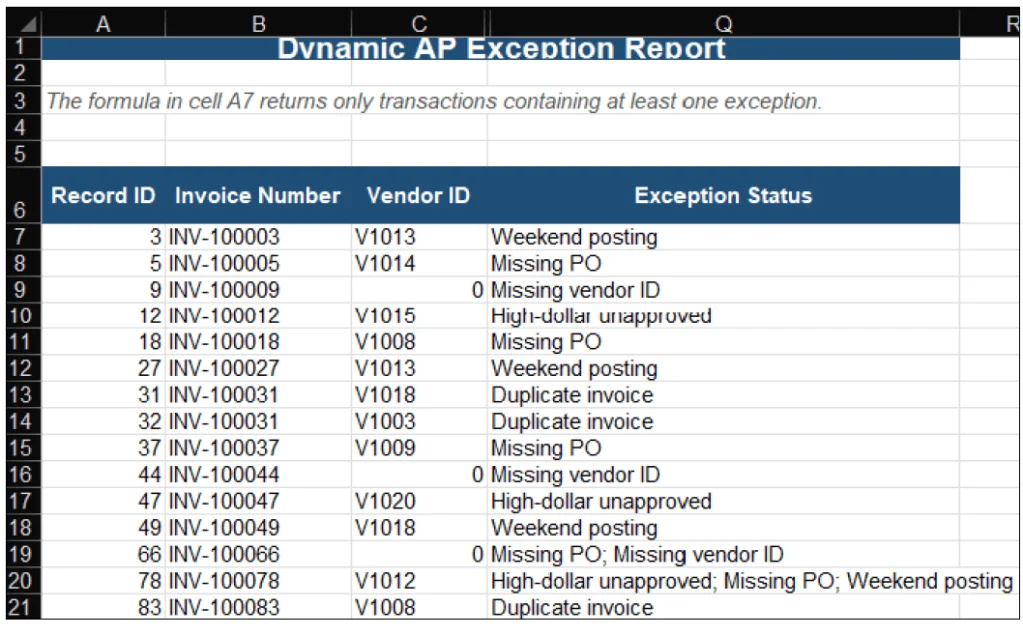
Once all columns are filled, it’s time to create an exception report. Navigate to the Exception Report worksheet and enter the following in cell A7:
=FILTER('AP Export'!A2:Q301,'AP Export'!Q2:Q301<>"","No exceptions found")
The FILTER function will extract and display only those transactions marked with exceptions, providing a streamlined view for further review.
Utilizing the Dashboard
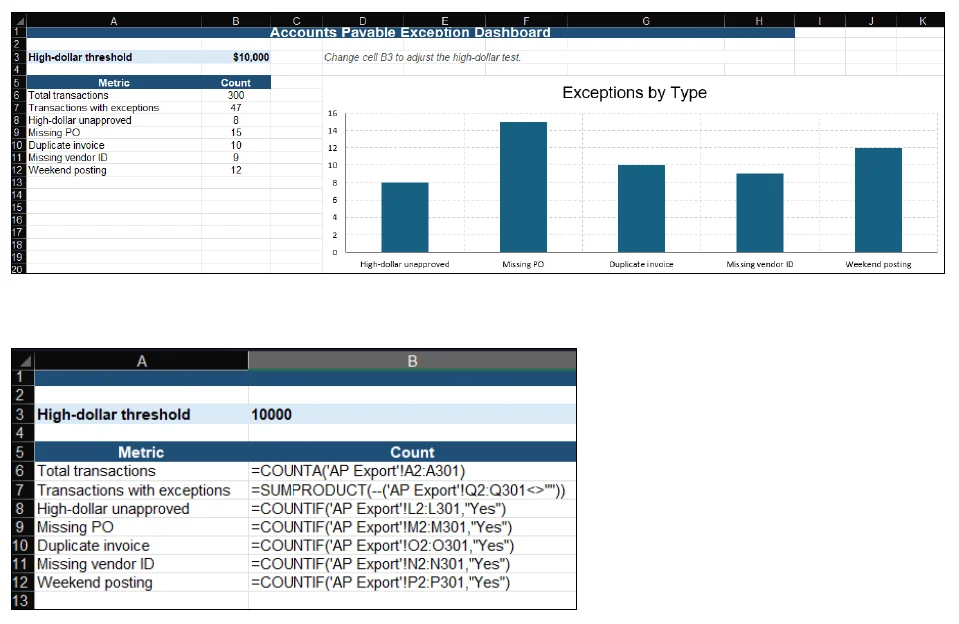
The Dashboard worksheet offers a comprehensive overview, summarizing key metrics such as total transactions and various exception counts. For instance, using the COUNTA formula in cell B6 provides the total number of transactions, while the SUMPRODUCT in cell B7 calculates those with exceptions. The remaining COUNTIF formulas quantify each specific exception type.
A clustered column chart can visualize these counts, enhancing immediate insight into where attention may be necessary.
Conclusion
By following these steps, accountants can repurpose standard transaction exports into powerful review tools, enabling time-efficient identification of unusual items. The resulting Excel workbook can be employed in future periods, requiring only updates to the underlying data while maintaining formulas and formatting intact. This can lead to a more focused, effective review process, allowing accountants to prioritize high-risk transactions and improve overall financial oversight.
Ultimately, the combination of logical formulas and advanced Excel functions can significantly elevate how transaction data is managed and analyzed, ensuring that accounting professionals spend their time addressing issues rather than sifting through data pointlessly.
About the Author
Kelly L. Williams, CPA, Ph.D., MBA, serves as an associate professor of accounting at the Jones College of Business at Middle Tennessee State University.
Submit a Question
For technology-related inquiries, feel free to reach out via email at [email protected].